
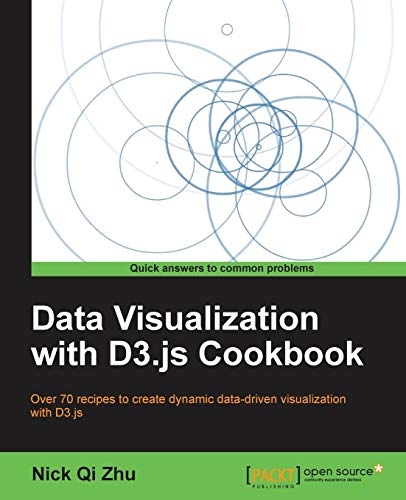
Data Visualization with D3.js Cookbook
Qi Zhu, Nick
ISBN 10: 178216216X ISBN 13: 9781782162162
Editorial: Packt Publishing, 2013
Usado
Encuadernación de tapa blanda
Librería:
Wonder Book, Frederick, MD, Estados Unidos de America
Calificación del vendedor: 5 de 5 estrellas

Honoris Librarius
Miembro de AbeBooks desde 1996
Este artículo en concreto ya no está disponible.
Descripción
Descripción:
Good condition. A copy that has been read but remains intact. May contain markings such as bookplates, stamps, limited notes and highlighting, or a few light stains. N° de ref. del artículo V12P-01075
Sinopsis:
Turn your digital data into dynamic graphics with this exciting, leading-edge cookbook. Packed with recipes and practical guidance it will quickly make you a proficient user of the D3 JavaScript library.
Overview
- Create stunning data visualization with the power of D3
- Bootstrap D3 quickly with the help of ready-to-go code samples
- Solve real-world visualization problems with the help of practical recipes
In Detail
D3.js is a JavaScript library designed to display digital data in dynamic graphical form. It helps you bring data to life using HTML, SVG, and CSS. D3 allows great control over the final visual result, and it is the hottest and most powerful web-based data visualization technology on the market today.
"Data Visualization with D3.js Cookbook" is packed with practical recipes to help you learn every aspect of data visualization with D3.
"Data Visualization with D3.js Cookbook" is designed to provide you with all the guidance you need to get to grips with data visualization with D3. With this book, you will create breathtaking data visualization with professional efficiency and precision with the help of practical recipes, illustrations, and code samples.
"Data Visualization with D3.js Cookbook" starts off by touching upon data visualization and D3 basics before gradually taking you through a number of practical recipes covering a wide range of topics you need to know about D3.
You will learn the fundamental concepts of data visualization, functional JavaScript, and D3 fundamentals including element selection, data binding, animation, and SVG generation. You will also learn how to leverage more advanced techniques such as custom interpolators, custom tweening, timers, the layout manager, force manipulation, and so on. This book also provides a number of pre-built chart recipes with ready-to-go sample code to help you bootstrap quickly.
What you will learn from this book
- Learn how to use functional JavaScript so you can write it the D3 way
- Select and manipulate HTML and SVG elements efficiently in D3
- Drive your visualization using data
- Master D3 scales and interpolators
- Animate your visualization with style
- Use SVG and various D3 path generators
- Explore D3 layouts and understand and leverage D3 force
- Build mobile-first interactive visualization with touch support
- Test-drive your visualization implementation
- Build multi-dimensional data visualization with crossfilter and dc.js in minutes
Approach
Packed with practical recipes, this is a step-by-step guide to learning data visualization with D3 with the help of detailed illustrations and code samples.
Who this book is written for
If you are a developer familiar with HTML, CSS, and JavaScript, and you wish to get the most out of D3, then this book is for you. This book can also serve as a desktop quick-reference guide for experienced data visualization developers.
Reseña del editor: Packed with practical recipes, this is a step-by-step guide to learning data visualization with D3 with the help of detailed illustrations and code samples.If you are a developer familiar with HTML, CSS, and JavaScript, and you wish to get the most out of D3, then this book is for you. This book can also serve as a desktop quick-reference guide for experienced data visualization developers.
"Sobre este título" puede pertenecer a otra edición de este libro.
Detalles bibliográficos
Título: Data Visualization with D3.js Cookbook
Editorial: Packt Publishing
Año de publicación: 2013
Encuadernación: Encuadernación de tapa blanda
Condición: Good